


Ethereum’s price may have been facing significant downside pressure due to an overall market downswing, which is believed to be caused by recent negative macroeconomic conditions. However, a seasoned crypto expert predicts a transition in price behavior from bearish to bullish for ETH as the asset could be experiencing a rebound in the short term.
A Notable Price Reversal Brewing For Ethereum
Ethereum price action is eyeing a potential bullish reversal from its current downward trend. Technical expert and investor Jonathan Carter points to a bullish formation that could spark a notable upsurge to key resistance levels.
Looking at the chart in the 1-day time frame, Ethereum has formed a massive Descending Channel pattern as bearish movements extend. A Descending Channel formation is considered a bullish technical pattern formed by connecting the lower highs and lower lows with parallel trendlines.
Once the price breaks above the upper trendline, it usually indicates that a rally could be on the horizon. As Ethereum hovers around the key technical pattern, the altcoin has formed a key support at the $2,060 level.
Jonathan Carter highlights short-term and long-term opportunities near this support level with targets at $2,360 and $2,560. In the event that Ethereum rebounds and breaks out of the descending channel, the expert foresees a move to the $3,450 mark, where the asset may witness increased buying pressure.

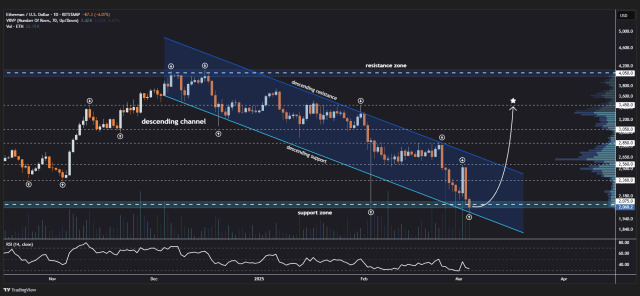
ETH’s breakout signals the beginning of a strong upward trend and the potential end of the ongoing correction. Should the rally continue, the next key resistance barrier to challenge is at $4,050, where the current downward trend initially began.
Analyzing the 1-week time frame, the much-anticipated reversal is capable of reaching new all-time highs in the upcoming weeks. Carter has identified a huge Ascending Triangle pattern on the weekly chart, signaling growing momentum toward the upside.
The chart shows that Ethereum is attempting to bounce from the ascending triangle support, which will propel its price into uncharted territory. Furthermore, the altcoin’s price has managed to stay above the 100-day Moving Average (MA) and the multi-year trendline. When the breakout occurs, Carter expects bullish momentum to drive prices to targets at $3,200, $4,000, $4,850, $6,000, and $7,500.
Has ETH’s Price Bottomed Out?
Recent downward trend has caused ETH to revisit a crucial level that previously led to a substantial upswing. Market expert and trader Titan of Crypto spotted the development, which indicates an impending price resurgence.
Specifically, Titan of Crypto noted that Ethereum has fallen to the 2024 low on the perpetual 1-day chart. Considering the 2024 price trend, the altcoin may have bottomed out and is gearing up for a rebound at the most significant point of interest.
