The Dogecoin price could be on the cusp of a massive breakout, according to a new analysis highlighting its rapid approach to a key Ascending Trendline. Historically, this chart pattern has sent Dogecoin skyrocketing by 200% and 400%. If the past is any guide, the meme coin’s next leg up could be even more dramatic, with a potential 600% surge to $0.93.
Dogecoin Price Targets 600% Climb To $0.93
In a chart posted on X (formerly Twitter), Trader Tardigrade, a crypto analyst, highlights a repeating pattern that has developed since late 2023. The analysis shows that each time the Dogecoin price retraced to an Ascending Trendline, the market responded with a steep rally.
The current Ascending Trendline is a long-term upward-sloping line marked by higher lows, indicating a strong uptrend support zone. In late 2023, Dogecoin bounced off this trendline, skyrocketing 200% a few months later. At the time, this massive surge lifted the meme coin from a price low between $0.055 and $0.061 to $0.117.
Less than a year later, in October 2024, Dogecoin touched the same Ascending trendline, experiencing a price surge twice as large as the previous one. The meme coin had soared from between $0.09 and $0.1 to $0.384, marking a dramatic 400% increase.
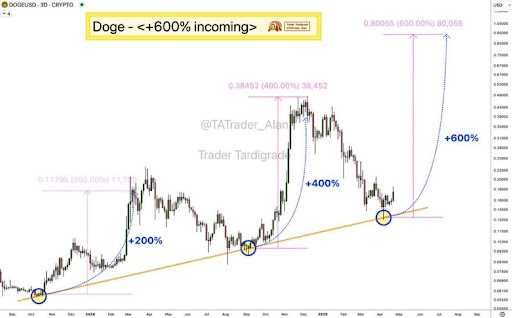
Now, in April 2025, Dogecoin is once again retesting this trendline support zone. Trader Tardigrade has predicted that a similar historical bounce could occur. However, this time, the meme coin is set to triple its first rally with a 600% surge. Currently trading at $0.18, this would effectively propel its price to $0.93.
Notably, the projected price target, which is just under the $1 psychological mark, would represent Dogecoin’s highest valuation since it’s all-time highs during the 2021 bull run. Moreover, if the forecast plays out as the analyst expects, Dogecoin could reclaim its place among the top-performing altcoins of the year.
DOGE Finds Solid Support In Order Block Zone
In another X post, Trader Tardigrade disclosed that Dogecoin has returned to a critical Order Block (OB) zone on its price chart, signaling the possibility of a strong bullish reversal in the near future. The one-hour chart reveals a clear market structure breakdown followed by a revisit of the least significant demand zone—the Order Block area between $0.1700 and $0.1725.
For more clarity, an Order Block refers to a price range where institutional investors and large holders previously entered strong positions. These areas often serve as strong support or resistance levels. In the past, the current Order Block acted as a launchpad for bullish momentum. Based on this historical trend, Trader Tardigrade suggests that a similar pattern could be forming again.
Through his chart analysis, the analyst also highlighted key structure points like Break of Structure (BOS) and Change of Character (CHoCH)—two important signals that a trend shift is underway.