


Bitcoin has experienced a sharp 14% drop in less than three days as the market entered a panic selling phase. The price fell below the weekly support around $90K, reaching a new low of $82K. This rapid decline has fueled speculation about whether Bitcoin has entered a bearish phase or if this correction presents a potential buying opportunity.
Investors are concerned as BTC struggles to reclaim key levels, and market sentiment remains fearful. However, some analysts believe that Bitcoin may be approaching a potential reversal point. Top analyst Axel Adler shared insights on X, revealing that the STH MVRV (155-day) metric has periodically dropped below one, historically indicating periods of short-term undervaluation and potential price reversals.
The next few days will be crucial as Bitcoin attempts to find support and stabilize. If BTC can reclaim key resistance levels, a recovery rally may follow. However, failure to hold the current range could lead to further downside, making this a pivotal moment for the entire crypto market.
Bitcoin Struggles As Bulls Look For Opportunities
Bitcoin has experienced a significant breakdown, with the entire market retracing sharply at the start of the week. The price dropped below key demand levels, and bears are in control as bulls struggle to establish strong support and reclaim critical price zones. Market sentiment remains split, with some analysts calling for a bear market, while others argue that this is a normal correction during a bull run before another leg up.
The uncertainty surrounding Bitcoin’s short-term direction has led to increased speculation. Adler’s insights reveal that the Short-Term Holder Market Value to Realized Value (STH MVRV) 155-day metric has dropped below one, a level that has historically indicated periods of short-term undervaluation and potential reversal points. The current values have once again approached lower levels, suggesting that BTC may be nearing a strong accumulation zone.

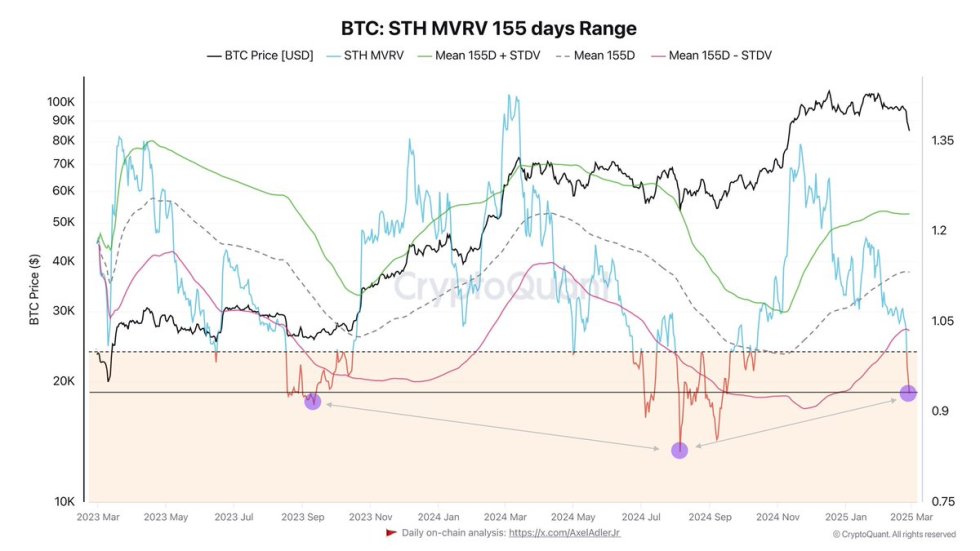
Historically, when the STH MVRV metric reaches these levels, it signals a buying opportunity for those expecting a long-term continuation of the bull cycle. If Bitcoin holds current levels and pushes back above $90K, it could confirm a reversal pattern and fuel a new uptrend.
However, if BTC fails to hold its current range, further selling pressure could push it into lower demand zones, creating more uncertainty in the market. The next few days will be crucial as BTC attempts to stabilize and find direction.
Price Testing Fresh Demand
Bitcoin is trading at $86,300 after a small bounce from the $82K zone, which aligns with the 200-day moving average, a key long-term support level. Bulls are attempting to regain control, but selling pressure has slowed down, suggesting that the worst of the recent correction may be over. However, momentum remains weak, and BTC has yet to reclaim significant resistance levels.

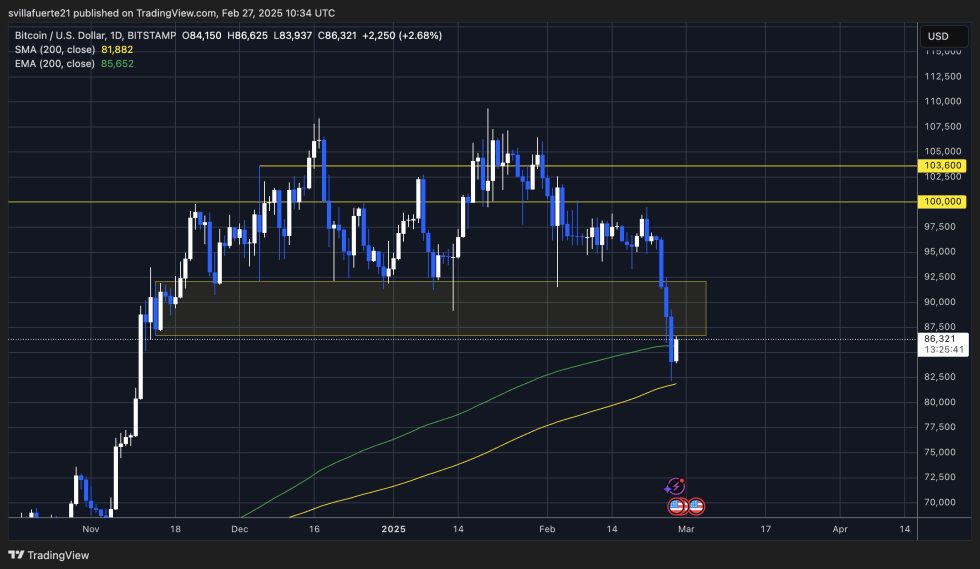
If Bitcoin manages to push above the $90K mark in the coming days, it could confirm a short-term recovery rally, allowing the price to retest key resistance zones and potentially continue the bullish cycle. However, failing to break above this level could lead to extended sideways consolidation, trapping price action between $82K and $90K for an extended period.
A slow recovery from current levels would signal that bigger players are accumulating, especially as on-chain data suggests that short-term holders are experiencing losses. But if BTC remains below key resistance levels for too long, it could indicate a prolonged correction phase before another leg up. The next few days will be crucial in determining whether BTC can recover above $90K or remain in range-bound consolidation before the next big move.
Featured image from Dall-E, chart from TradingView
SIGN UP FOR LIGHTCHAIN 2025 - BUY NOW