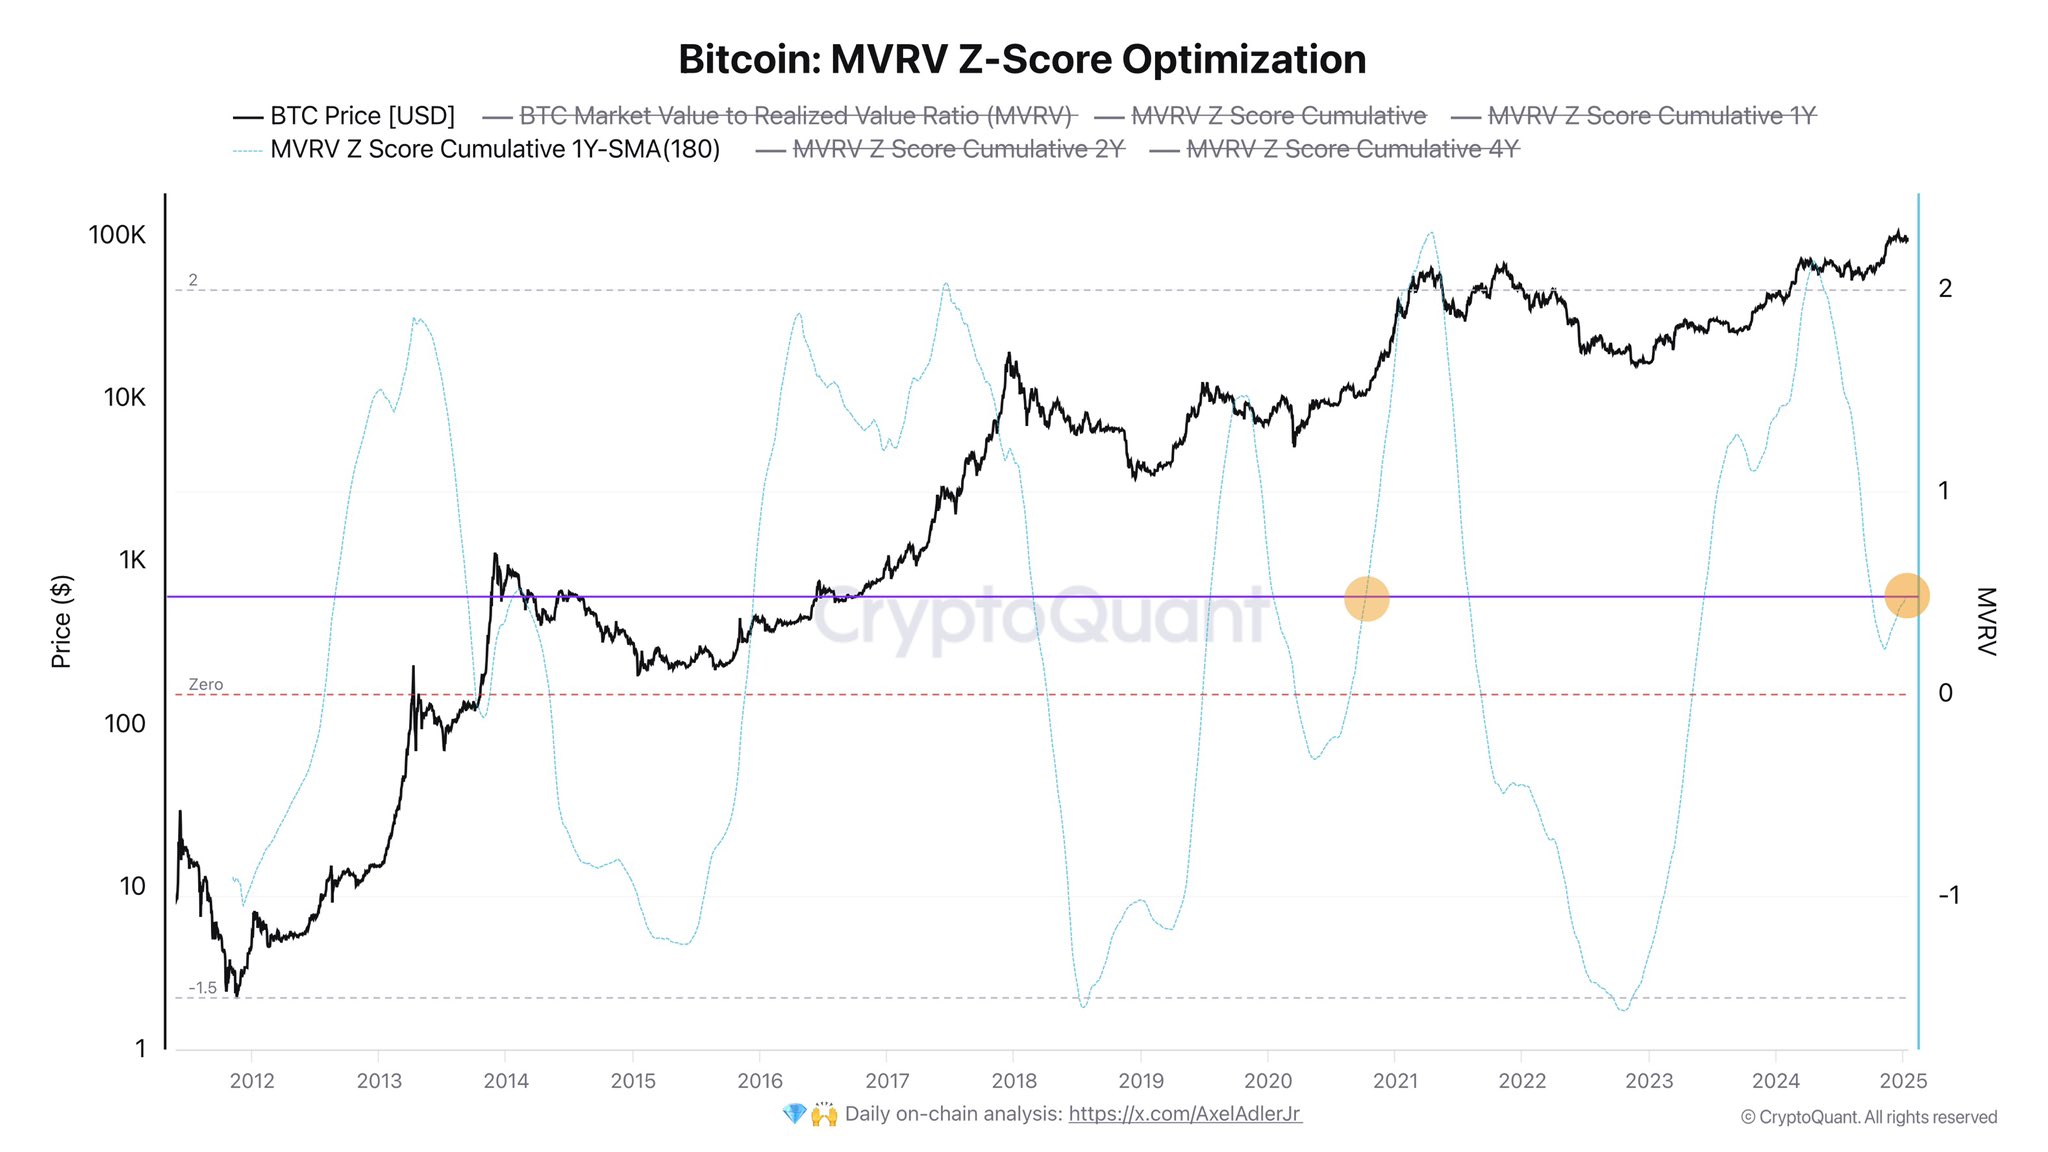
An analyst has revealed how Bitcoin may not be at extreme overbought levels despite its latest rally, according to this on-chain indicator.
Bitcoin MVRV Z-Score Could Imply Asset Still Has Room To Grow
In a new post on X, CryptoQuant author Axel Adler Jr has discussed about where Bitcoin currently stands from the perspective of the MVRV Z-Score. The “Market Value to Realized Value (MVRV) Z-Score” is an on-chain metric that compares the market cap and realized cap of Bitcoin, and applies a standard deviation test on the data to find points of extremes.
The “realized cap” here refers to a capitalization model of the cryptocurrency that calculates its total value by assuming that the ‘true’ value of any coin in circulation is the last spot price at which it was moved on the blockchain.
Since the last transfer of any token is likely to be the last point at which it changed hands, the indicator essentially calculates the sum of the cost basis of the BTC supply. In other words, it keeps track of the total amount of capital the investors as a whole have put into the asset.
When the MVRV Z-Score has a high value, it means the market cap is significantly above the realized cap. Such a trend implies the holders are in a high amount of profits. On the other hand, it being low can suggest the dominance of losses in the market.
Now, here is a chart that shows the trend in the 180-day moving average (MA) of the Bitcoin MVRV Z-Score over the history of the cryptocurrency:
The 180-day MA value of the metric appears to have seen a turnaround in recent days | Source: @AxelAdlerJr on X
From the graph, it’s visible that the 180-day MA Bitcoin MVRV Z-Score reaching the 2 mark has historically coincided with tops in the price. At this high level, the market cap is significantly greater than the realized cap and thus, the investor gains are of a high degree.
Holders become more likely to fall to the temptation of profit-taking the higher their profits get, so mass selloffs can occur during points where there is an extreme imbalance in the market. This is the reason why a high MVRV Z-Score generally implies a top for BTC.
As is apparent in the chart, a similar pattern is also visible for bottoms, where the 180-day MA of the indicator dropping below -1 results in bottoms for the cryptocurrency. When investors as a whole are underwater, there aren’t many profit-takers left, so the price downtrend tends to reach exhaustion.
Back in the first half of 2024, the 180-day MA of the MVRV Z-Score briefly surpassed the 2 level, signaling the top that occurred then. The indicator has since come down to notably lower levels, however, implying BTC isn’t that overheated at levels above $100,000 yet.
If the historical pattern is going to continue to hold, then this trend could imply room for Bitcoin to run in the current cycle.
BTC Price
Bitcoin has continued its recent recovery wave during the last 24 hours as its price has now surpassed the $102,200 level.
Looks like the price of the coin has been climbing up over the last few days | Source: BTCUSDT on TradingView


