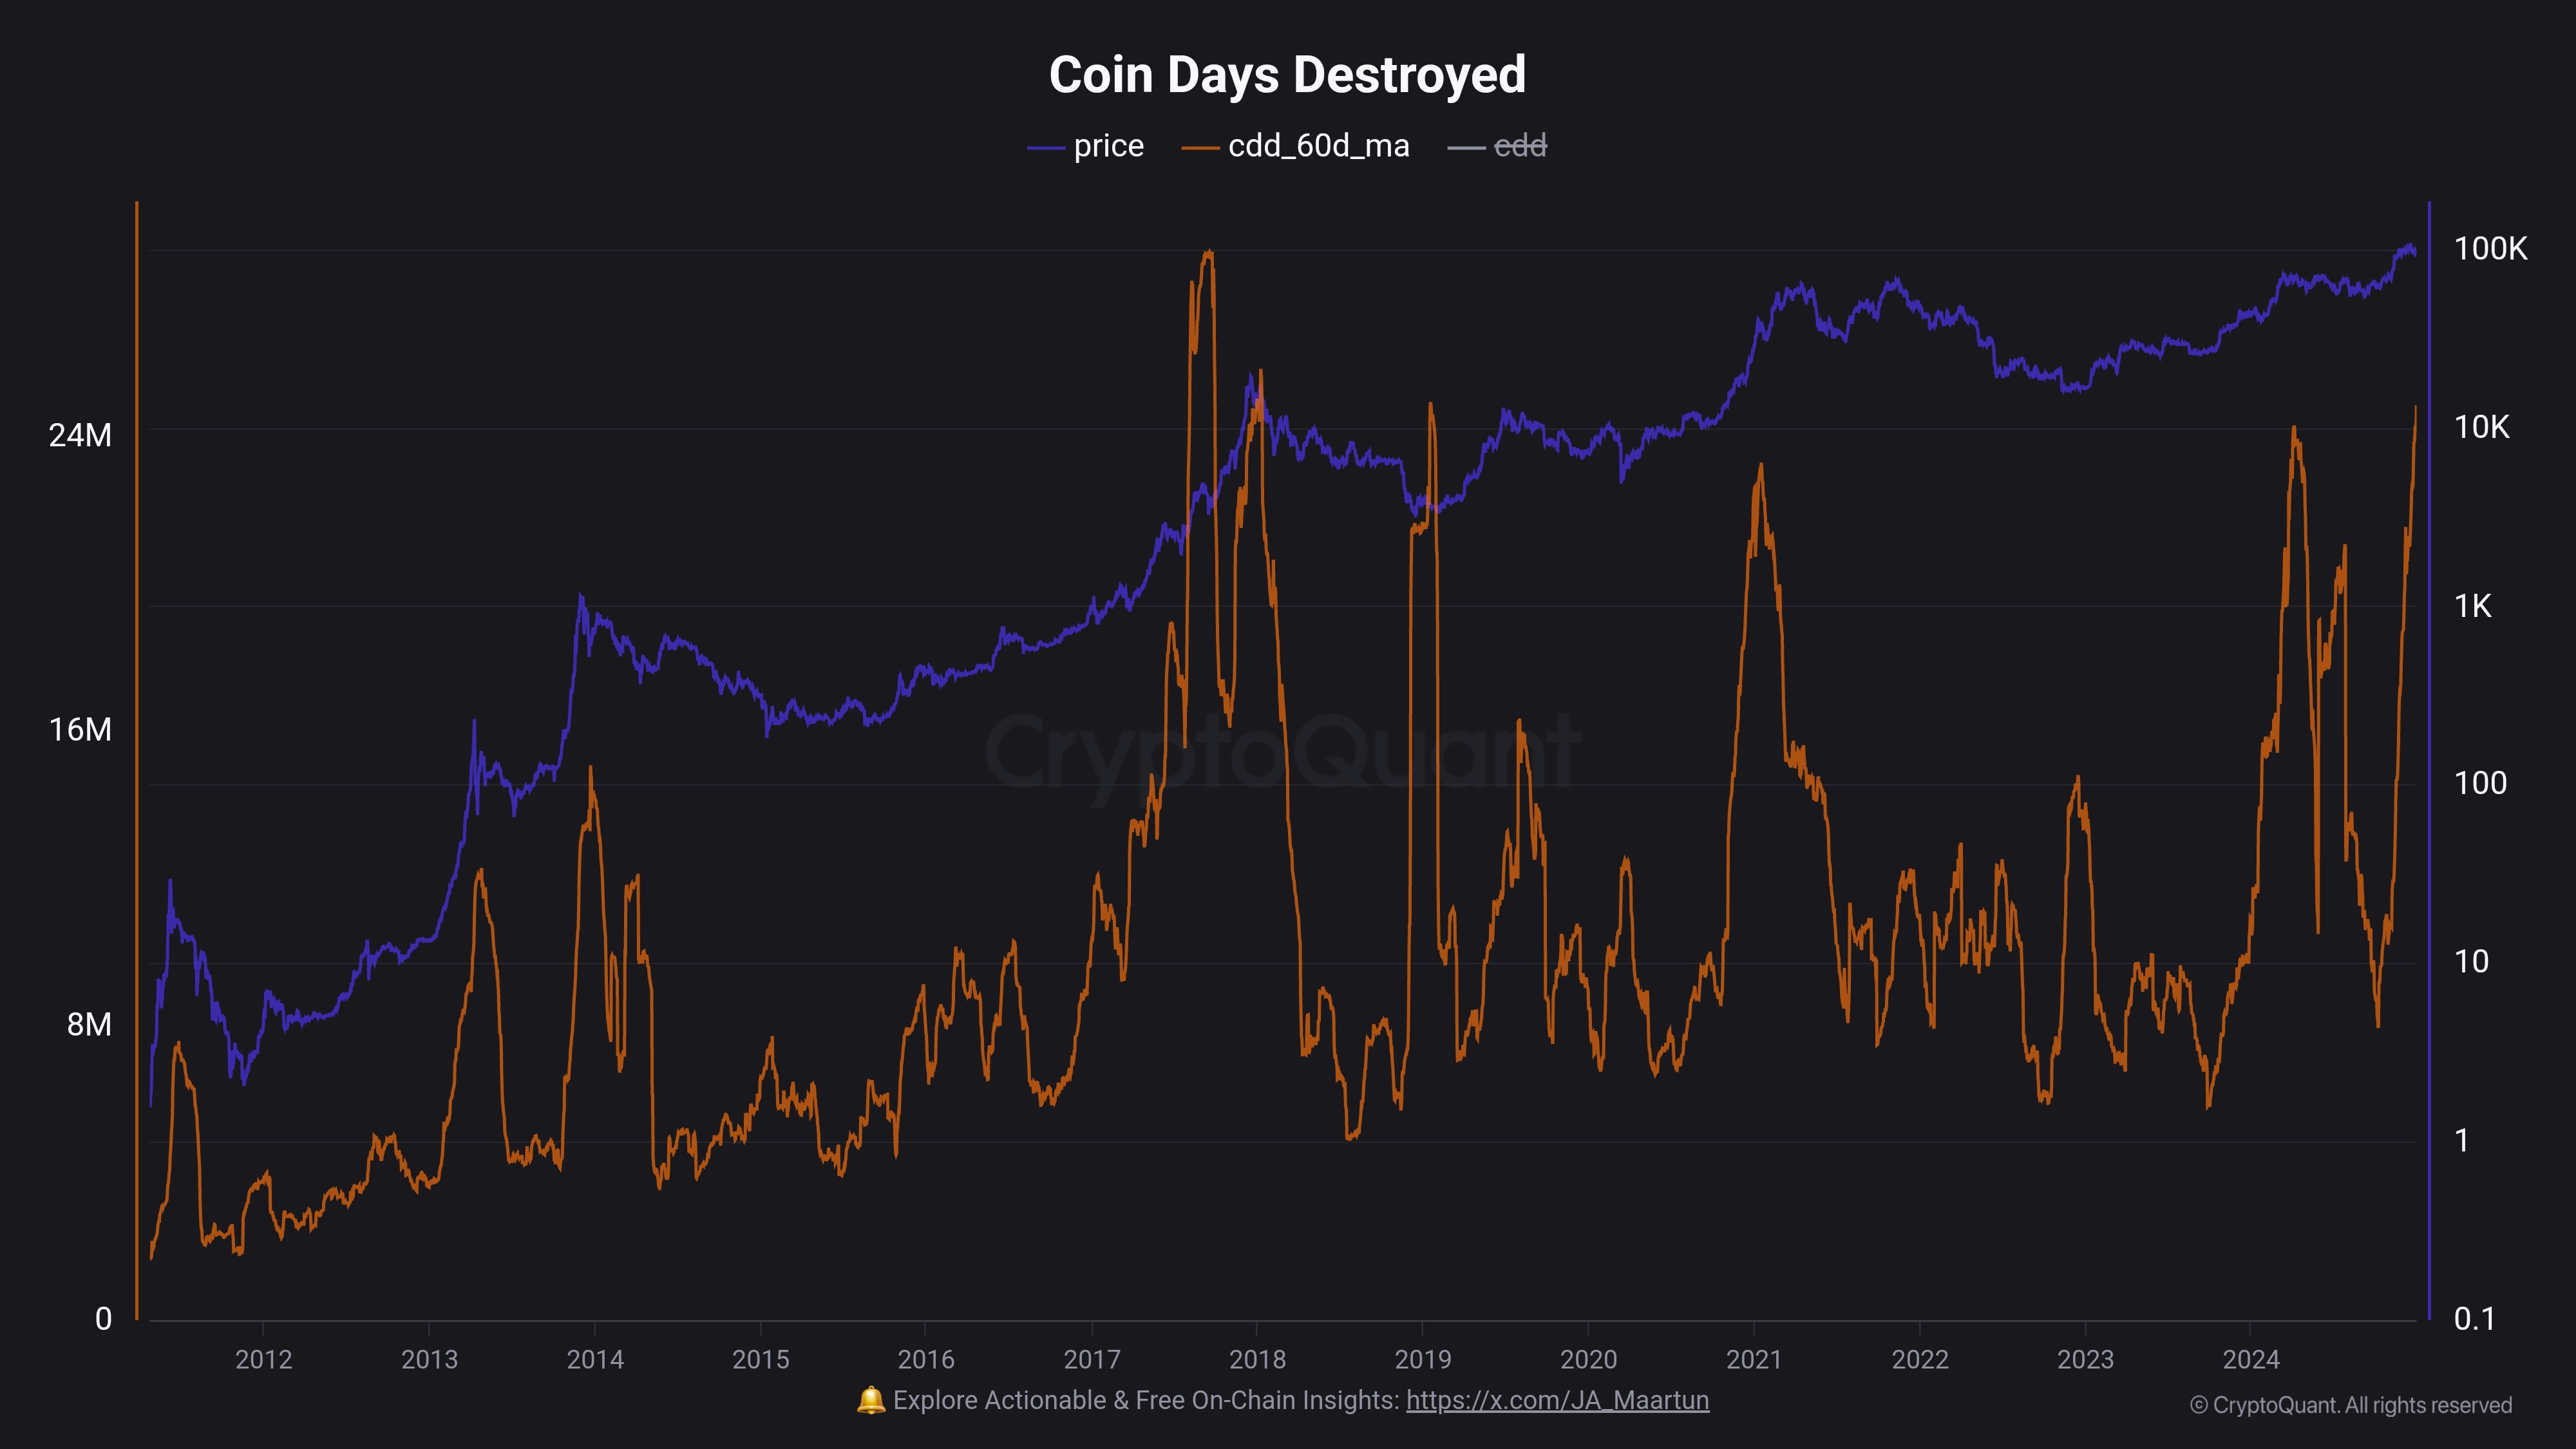
On-chain data shows the Bitcoin Coin Days Destroyed (CDD) has spiked to a six-year high recently. Here’s what this could mean for BTC’s price.
Bitcoin CDD Has Registered A Sharp Increase Recently
As pointed out by CryptoQuant analyst Maartunn in a new post on X, the 60-day moving average (MA) of the Bitcoin CDD has recently crossed the 24 million mark.
To understand how the “CDD” works, the concept of “coin days” must be looked at first. A coin day refers to a quantity that 1 BTC accumulates after staying dormant on the network (that is, sitting still inside a single address) for 1 day.
As coins stay motionless for a number of days, they gain coin days of the corresponding amount. Once they are moved, their coin days counter naturally resets back to zero, and the coin days that they had previously been holding are said to be ‘destroyed.’
The CDD is an indicator that measures the total number of coin days being destroyed in this manner across the blockchain every day. Here is the chart shared by the analyst that shows how the 60-day MA of the indicator has changed over the history of the cryptocurrency:
The 60-day MA value of the metric appears to have been sharply climbing up in recent months | Source: @JA_Maartun on X
As displayed in the above graph, the 60-day MA of the Bitcoin CDD has observed some rapid growth recently, which suggests an increasing amount of dormant coins has been becoming involved in transactions. Following the most recent continuation of the uptrend, the indicator has hit 24.8 million, the highest level in around six years.
Generally, spikes in the metric correspond to movements from the long-term holders (LTHs). The LTHs refer to the resolute entities in the sector, who hold tightly through rallies and crashes alike and, in the process, accumulate large amounts of coin days.
The LTHs usually only break their silence when they believe it’s the time to sell, so large values in the CDD can indicate that these diamond hands are participating in a selloff.
From the chart, it’s apparent that peaks in the indicator have often coincided with some sort of top in the Bitcoin price. This trend most recently occurred in the first quarter of 2024.
Given this historical pattern, it’s possible that the latest potential selloff from the LTHs could also have a similar effect on the cryptocurrency. This may also already be in action, as the asset has been following a bearish trajectory since its top above the $108,000 level in mid-December.
BTC Price
At the time of writing, Bitcoin has been floating around $95,600, which is up almost 3% in the last 24 hours.
Looks like the price of the coin has been making another attempt at recovery in the past day | Source: BTCUSDT on TradingView


